This is the beginning of a beatiful collection of charts

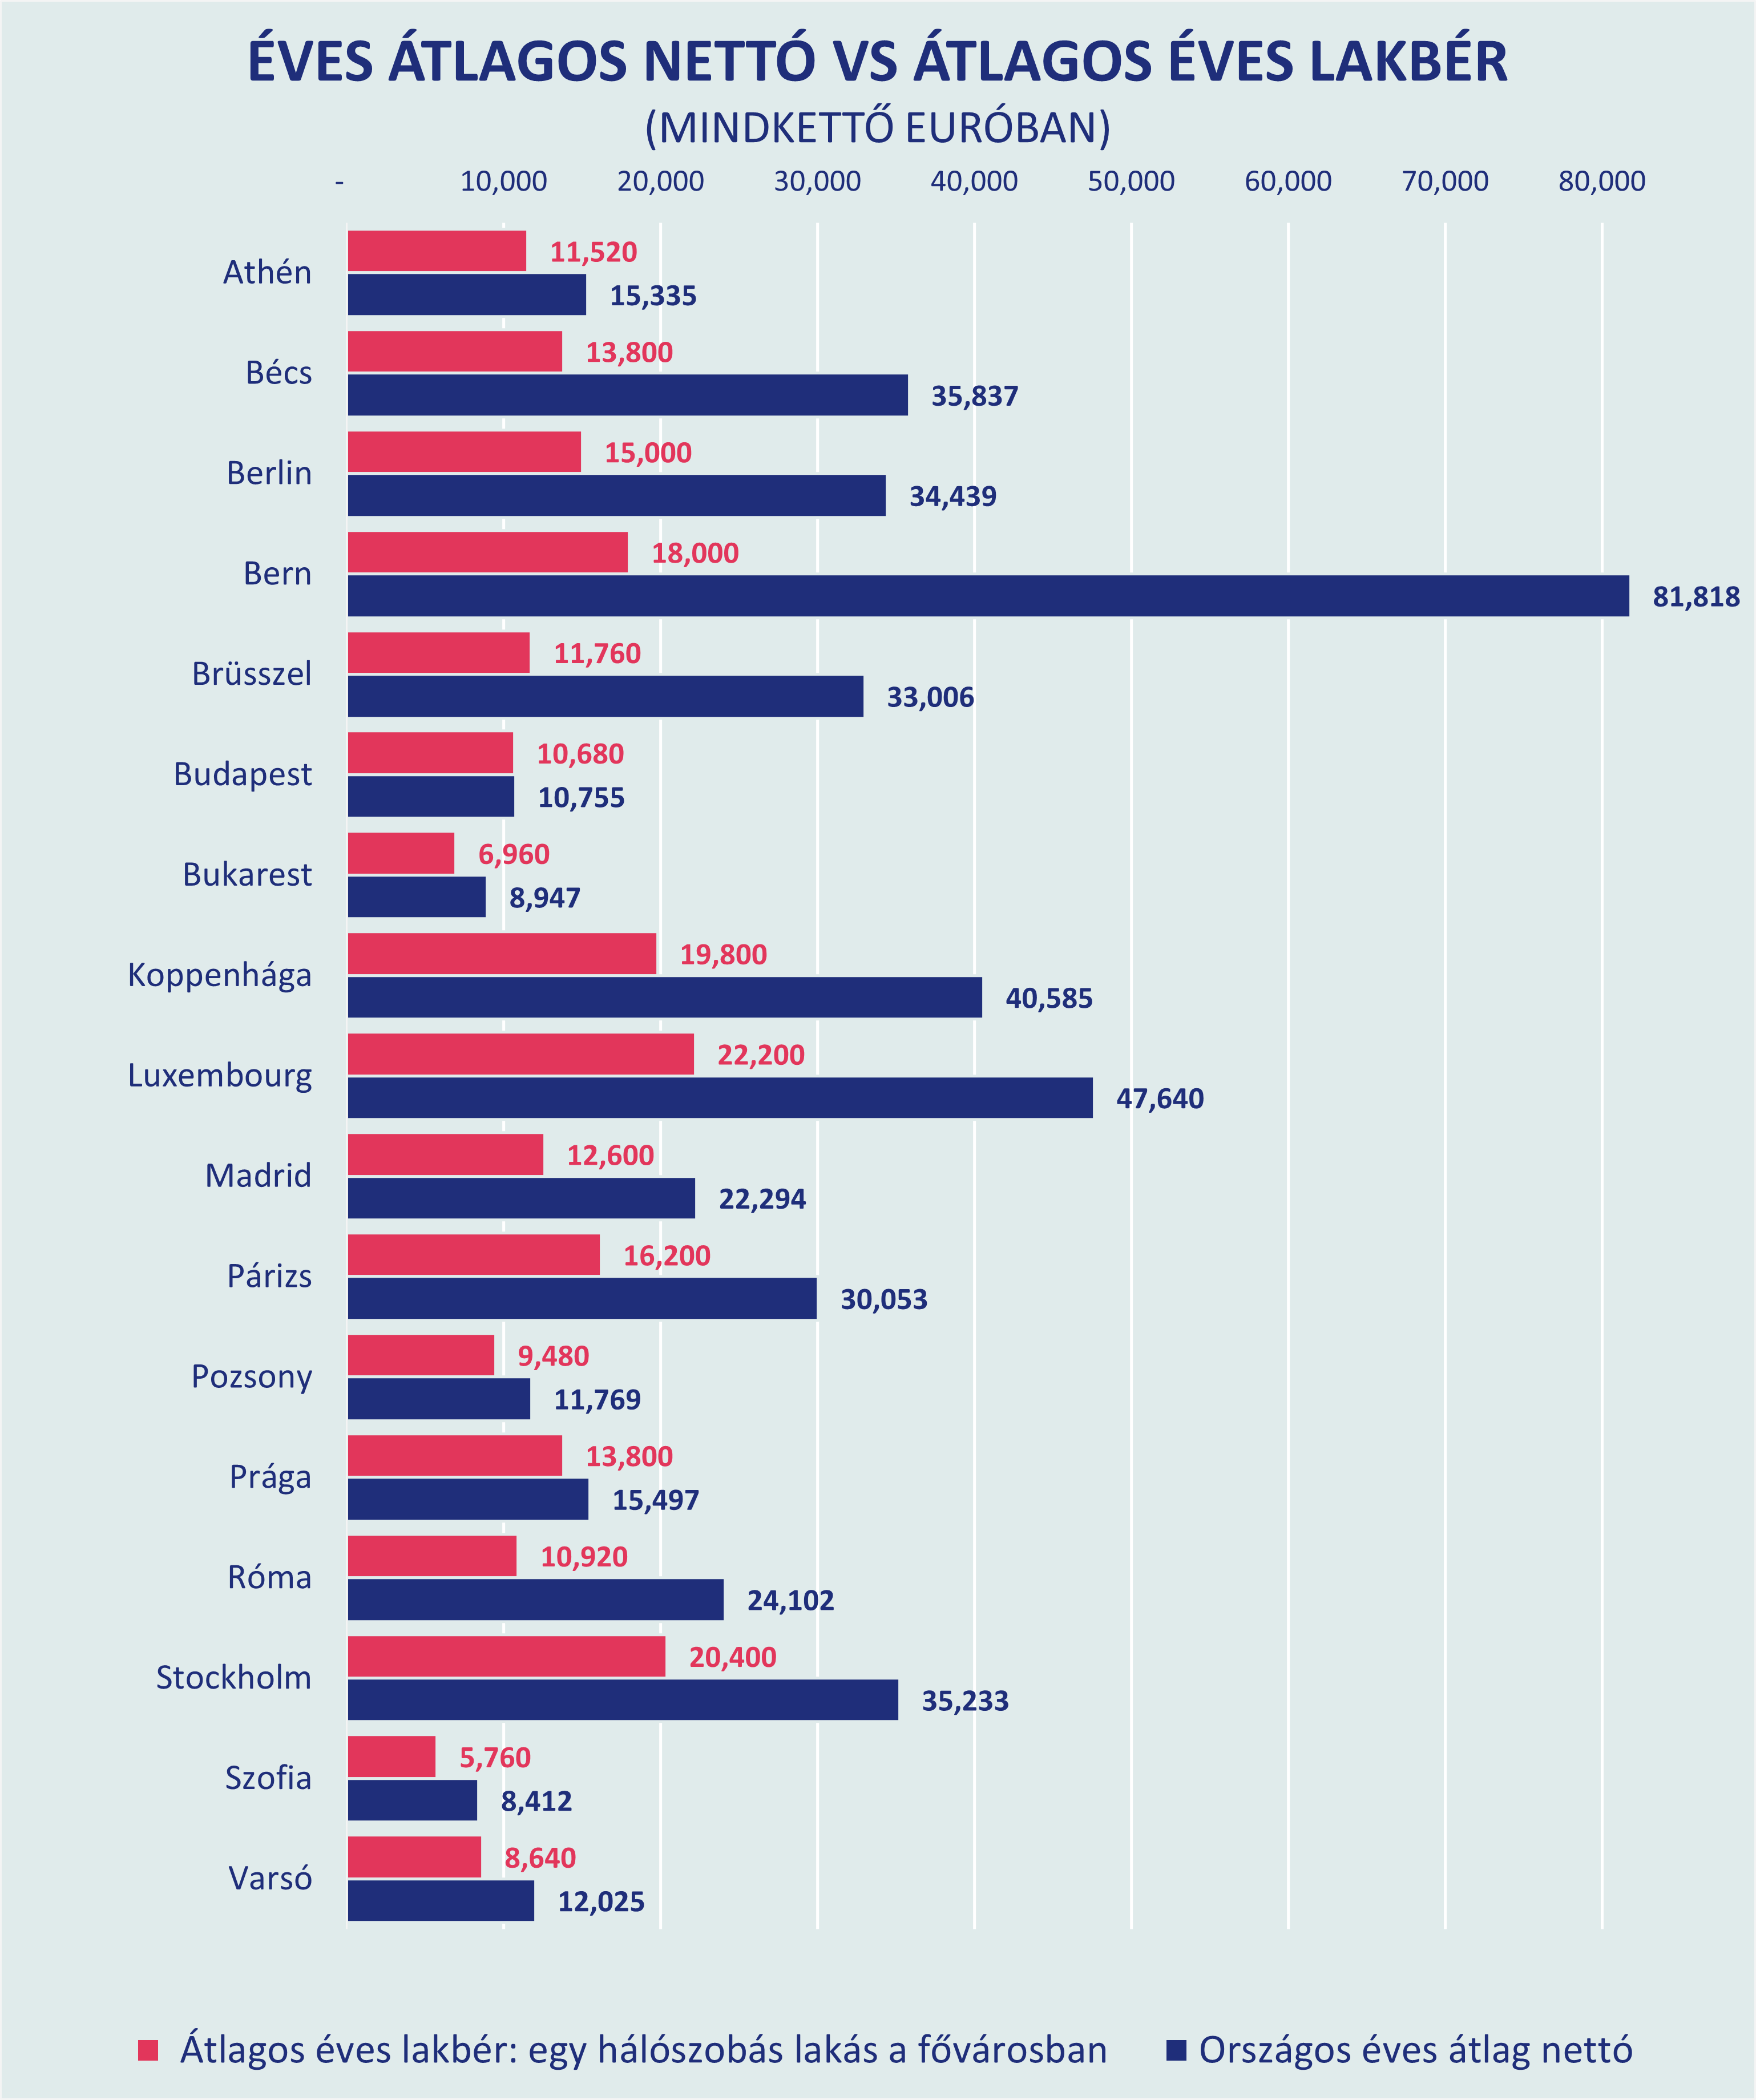
I am creating various charts, some of them are interesting. Wanted to have a platform where I can save a few of these. So here we go. These charts were designed to show how expensive it is for the average worker earning average net salary to rent an average apartment in various EU capitals. For the charts I used Eurostat data, like this and this.